
We had our first snow of the winter followed by a day of brilliant blue skies – both were icy cold. The juxtaposition of these days has, however, created a clear picture of the effectiveness of our air source heat pump central heating.
The best way to illustrate this is to take a look at the data from our SolarEdge app that shows our solar production and electricity consumption as a household over those two days.

The graph above shows that we consumed and imported a staggering 80.1kWh of electricity, generating no electricity of our own. There’s a myriad reasons for this:
- Our solar panels were covered in snow for a couple of key hours
- It was a dark, overcast and gloomy day
- After the snow finished, it continued to drizzle throughout the day
- The temperature maintained around 0-2C

24 hours later we had another cold day, but there wasn’t a cloud in the sky. We took the opportunity to do some laundry and tumble-drying, along with other electricity intensive tasks to take advantage of the solar production. During this time, all excess solar was pushed to heating our hot water via the iBoost.
Even though we consumed 84.52kW of power, we generated 18.6kW and had to import 65.92kW. Had we not done the washing/drying, we would have finished closer to having to buy in 60kW.
Correlation between Air Source Heat Pump and Cold Weather
So where does this leave us with regards to the efficiency of our central heating? Well, on the snowy day, where it was dark, gloomy and cold, and where we didn’t produce any solar energy, the bulk of our electricity usage went to the air source heat pump (ASHP).
We had to import 80kW – at our rate (0.138p/kWh) that equates to £11. If every day was to be like this, it would cost us around £330 in electricity per month, the bulk of which is driving the ASHP. That is not cost-efficient versus oil.
To put things in content, on October, we didn’t exceed the 50kW import mark.
The thing is, we don’t expect to hit the 80 mark everyday, but this is the first year we’ve used the pump through the winter so the reality is we don’t really know what to expect.
Yesterday, three days after the snow, the weather was very mixed: cold with patches of sunshine and occasional showers. We consumed 73.5kW of electricity, offsetting 10kW from solar, meaning we had to buy in 64kW (£8.80).
It’s starting to look highly likely that our average electricity consumption is going to be around (or above) 70kW per day. If it is, that will equate to £289/month for all our electricity.
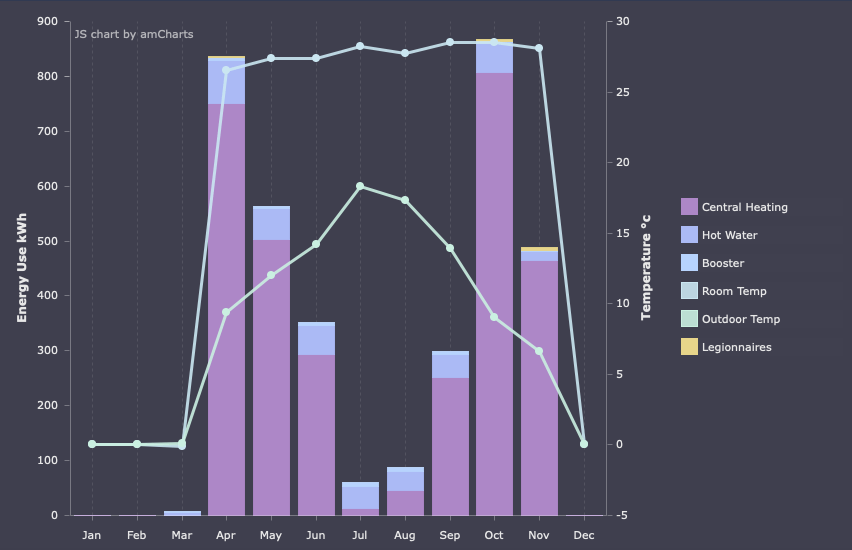
As we can see from the chart below, we are only one-third of the way through November, and we are well on course to exceed our heating requirements in what was a chilly October.
The real metric will become apparent at the end of the month when I can accurately separate our electricity consumption by heating and other uses. That will create a very interesting picture.
The Trend
At this early stage, there is a definite trend beginning to emerge as you hit cold times. We know that heat pumps don’t function efficiently when you start to hit the 0C mark. This is becoming incredibly evident in our case.
Our plan was to always have the solar to help offset the ASHP so for us the worst case scenario is to have bitterly cold days that are overcast. Cold days, with sunshine, are far better. It also doesn’t help that days are getting shorter and shorter and we still have over a month to go to the winter solstice before we reverse the daylight cycle.
It is, however, still early on in our air source heat pump usage. Every portion of the house is heated to a minimum of 19C 24/7, and various zones around the house rise to 21C when we typically use these areas/rooms.
The house is generally very warm, everywhere.
While the increase in electricity is getting higher and is getting on par with oil, it is a greener, more environmentally-friendly way of heating our house and the entire house is being heated as opposed to certain zones, at certain times of the day when we were running the oil boiler.
Continue to watch this space for real life data and updates, and it’ll be interesting to see what happens to our coefficient of performance (COP).