
As part of our ongoing sustainability journey at Home Farm, we annually review our solar production, air source heat pump efficiency and the weather for the past 12 months.
Somewhat frustratingly, Global Energy System’s online portal has been down for a few days as they have been updating their software, so we weren’t able to access our air source heat pump data, which should make for some interesting reading based on our switch to HVO to help the heat pump run more efficiently this winter. We’ll publish a fresh post later in January that’s dedicated exclusively to the air source heat pump’s performance in 2021. We’ll also discuss running costs.
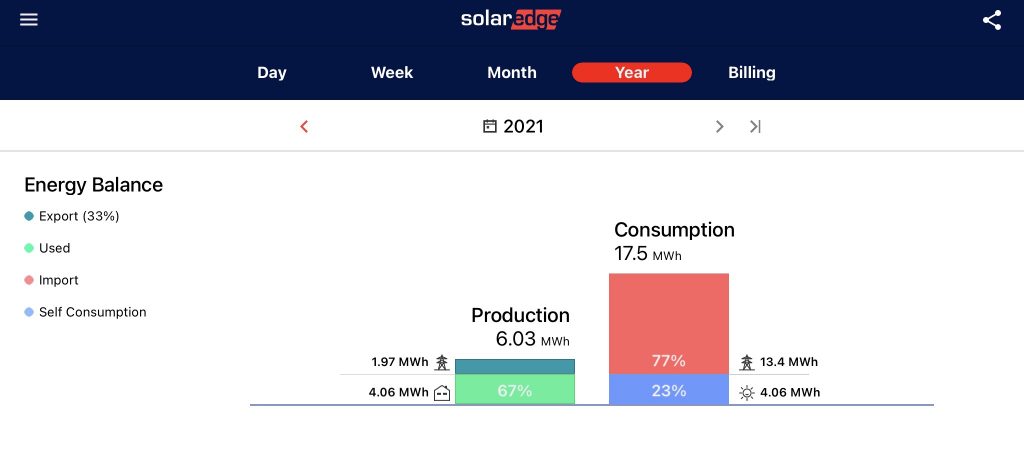
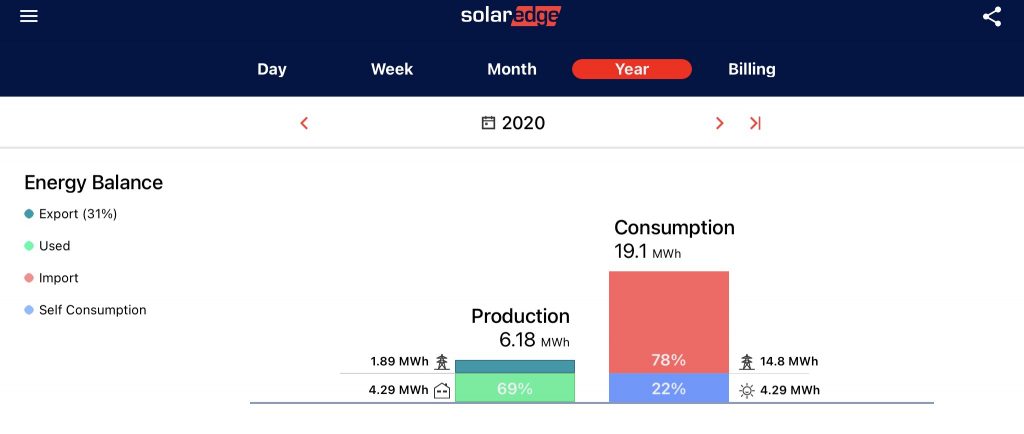
On the solar PV front, it was a very similar year in terms of electricity generation to 2020. In 2021 our 6.16kW array produced 6.03MWh versus 6.18MWh in 2020. You’ll notice a decrease in consumption and that has to do with our switch to HVO in the winter.
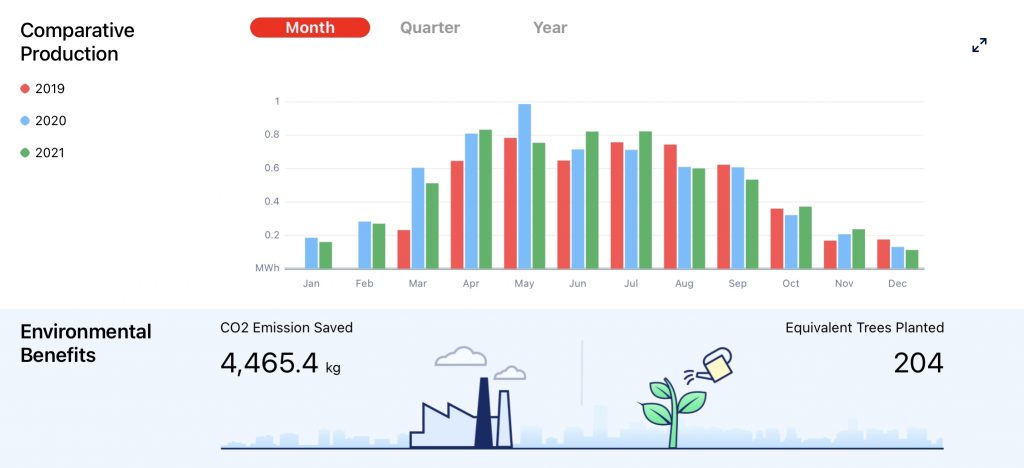
The graph below is interesting in illustrating the strongest months for our system’s solar production, and it shows just how poor production is from November to February compared to the rest of the year. We’re also very pleased that we’ve saved releasing nearly 4,500kg of CO2 into the atmosphere in just under three years.
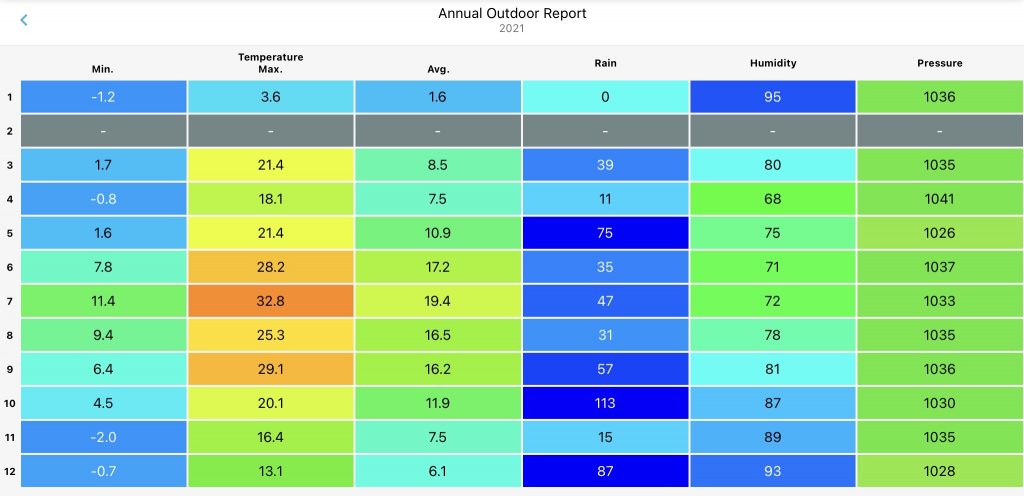
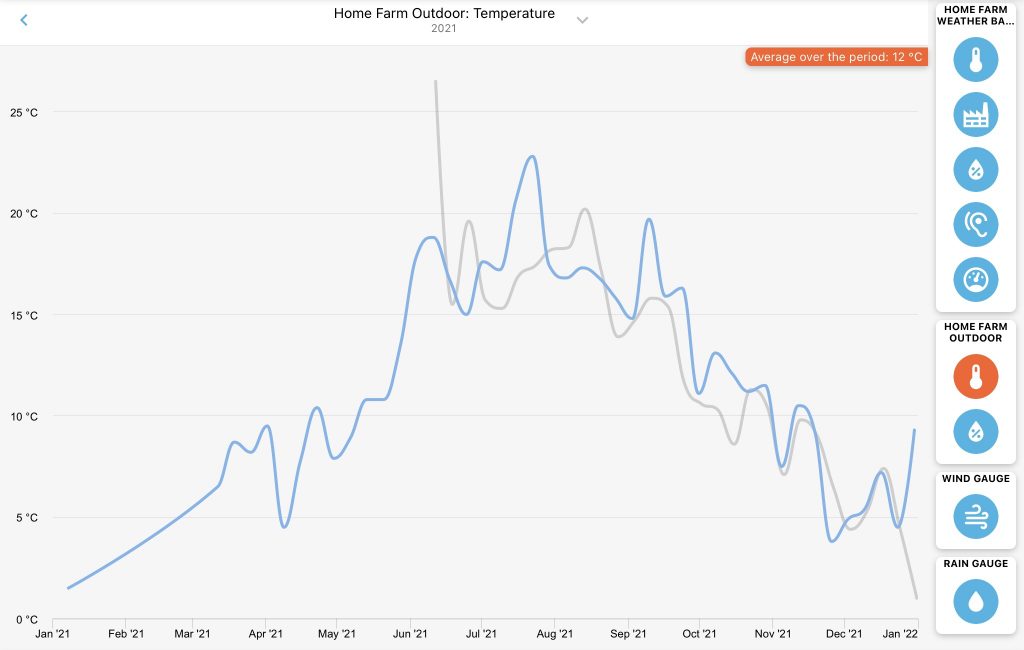
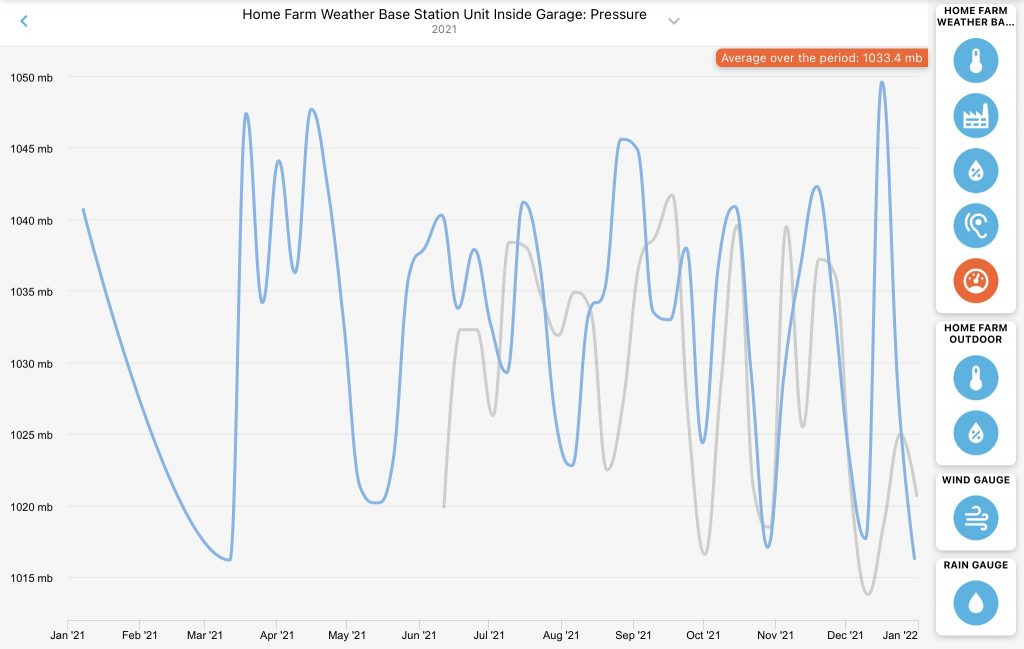
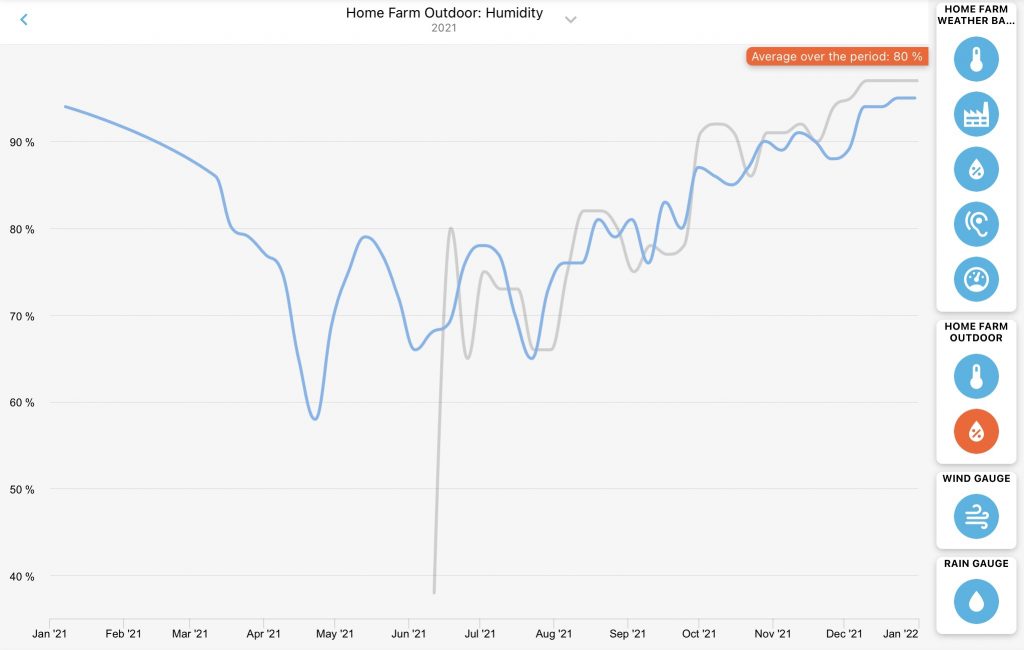
The weather has also been an interesting topic. I must caveat this section by saying that we had a glitch with our Netatmo home weather station in January and February (which I didn’t realise at the time) so our data is incomplete, but it still paints a picture.
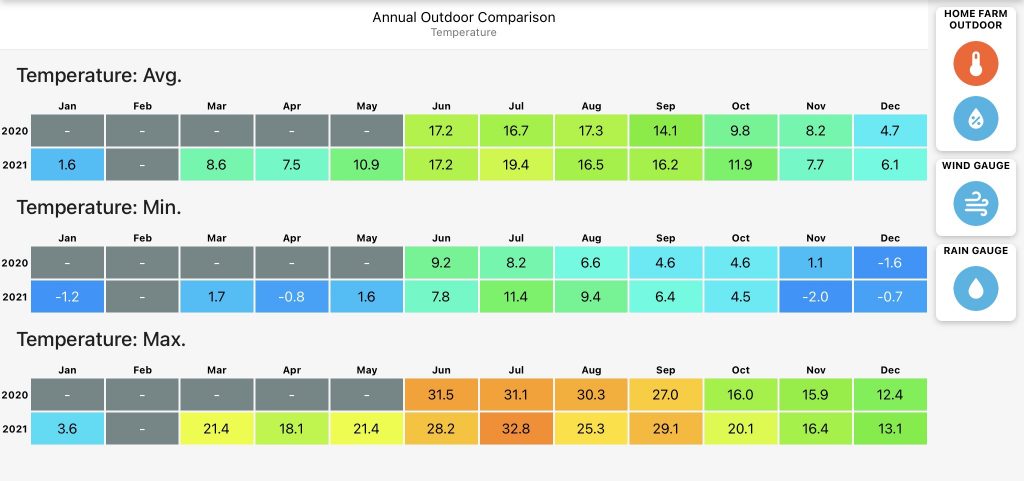
So let’s talk global warming. Both Kirsten and I both commented that this year generally felt warmer and the average temperatures, from June onwards, definitely highlight this. July was roasting, and September, October, November and December were extremely mild. What’s crazy is that, on average, most months were over 1.5C warmer than last year.
We have yet to experience an extremely cold spell this winter, which is rare for us. December has been ridiculously warm, and it’s been bordering on T-shirt and shorts temperatures.
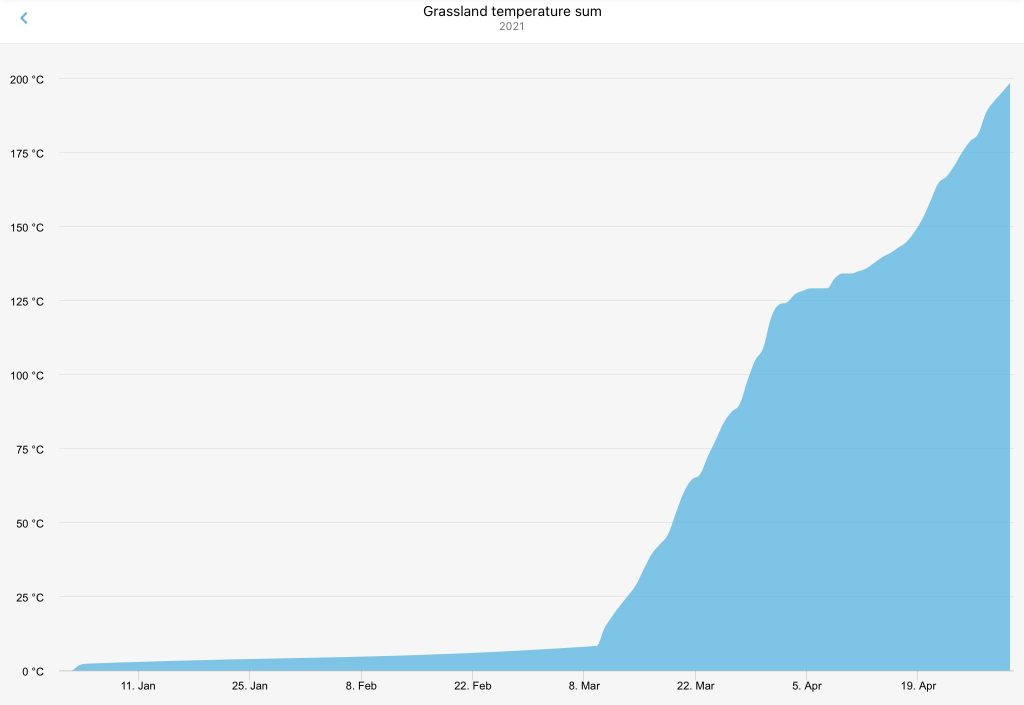
This next bit is new to me – the grassland temperature sum. This is used in Europe to determine the date for starting field work. This sum is calculated by taking the positive daily average air temperature starting at the beginning of the year and adding them together.
In January they are multiplied by a factor of 0.5, in February by a factor of 0.75 and from March the full daily value (factor of 1) is included in the calculation. When the sum exceeds 200 in spring, the “sustainable beginning of vegetation” has been reached. For us, we hit that mark around 23/24 April. I’m guessing we’ll hit it earlier in 2022.
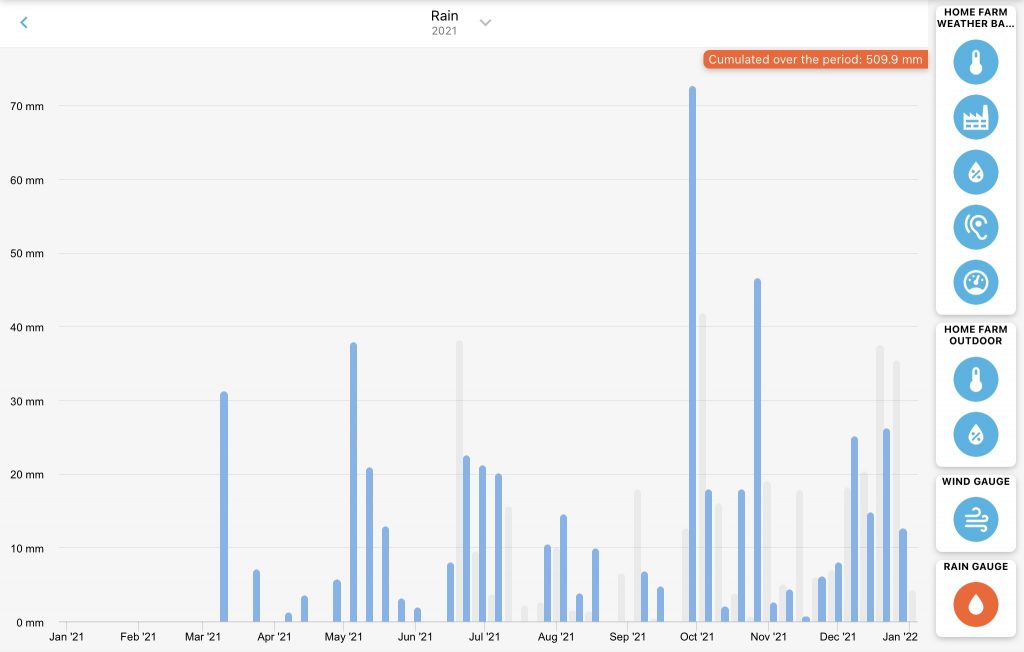
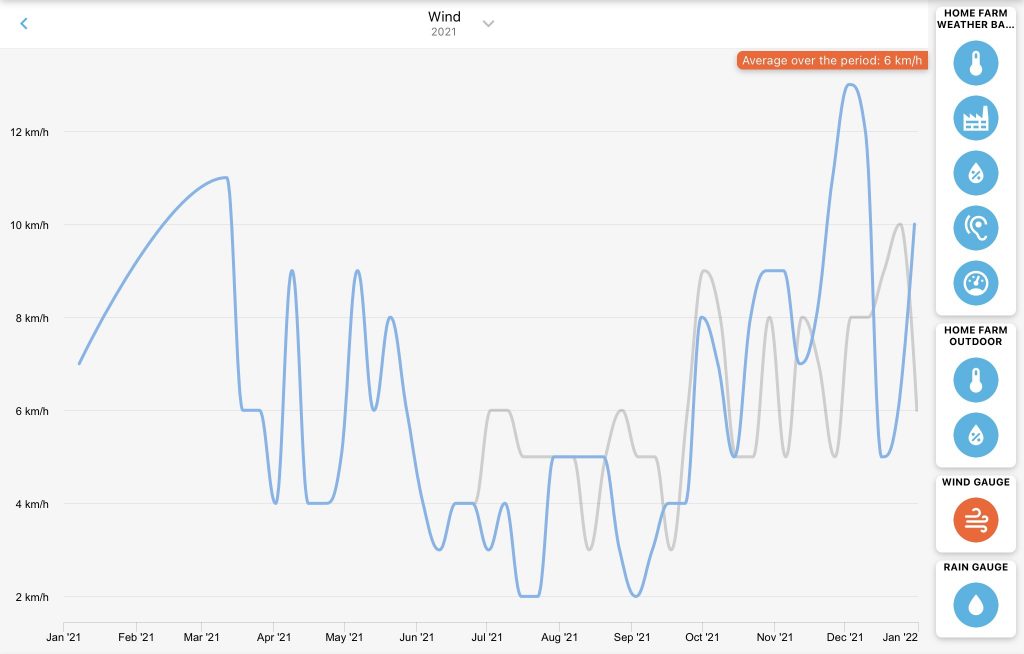
To view our comparative weather charts for rain, temperature, pressure and humidity for 2020-2021 please go through the graphs in the gallery below.
Our strongest wind gust was 88km/h on November 28, 2021, when storm Arwen hit us. Hottest day of the year was July 18, when the mercury hit 32.8C.
As a point of reference, we’re in the West Midlands (Welsh borders), and we would love to hear how your weather and solar PV production compared with us. Please leave a comment below.
In closing, we’d like to wish all our followers a safe and prosperous 2022.