
The weather from late spring into summer has been all over the radar. After a dry, sweltering May, the temperatures have remained on the cool side with a lot of cloud cover. We’re kicking off a series of monthly posts where we’re going to compare our local weather data from our Netatmo weather station against historic averages for our corner of the world.
Looking at the weather data for the past 20 years, we typically get 59mm of rain in July, with an average temperature of 16C. The Netatmo weather data below made for some interesting reading and comparisons.
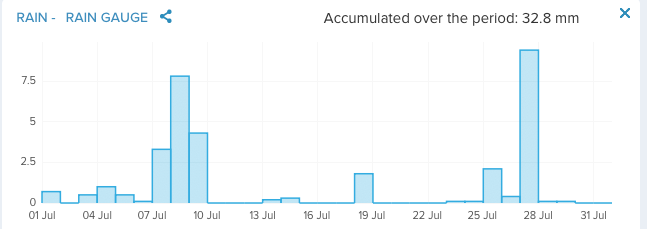
Despite a lot of overcast grey skies, precipitation was limited to light drizzles, and we registered 32.8mm of rain. That’s almost half the monthly average, and explains why we spent a fair amount of time in garden with the hose pipe giving the flowers, fruit trees and vegetables a drink.
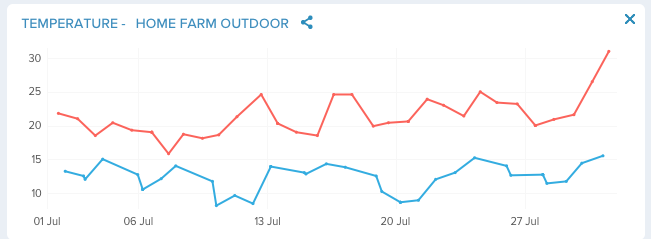
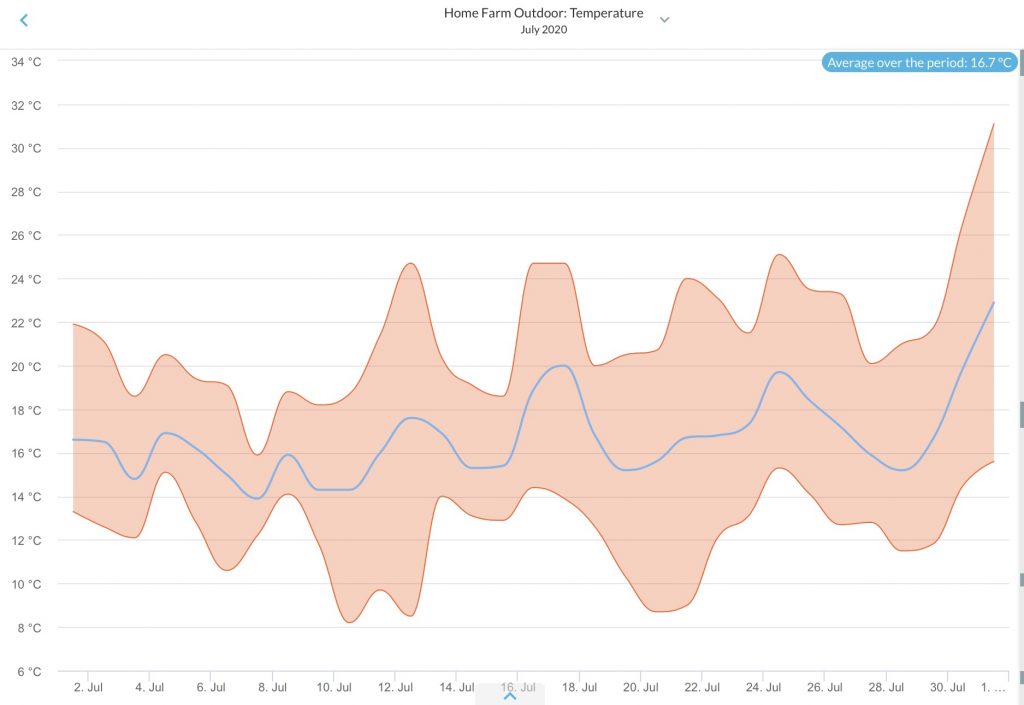
The average temperature was 16.7C, close to the historical average, with the hottest temperature recorded at 31.3C on July 31, 2020. Despite us hovering close to the historic average, the most surprising aspect has been the large temperature fluctuations, where maximums from day to day have swung by nearly 10C on back-to-back days.
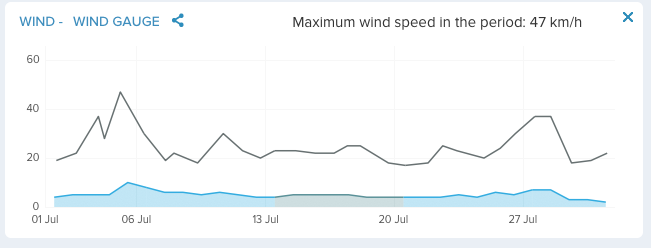
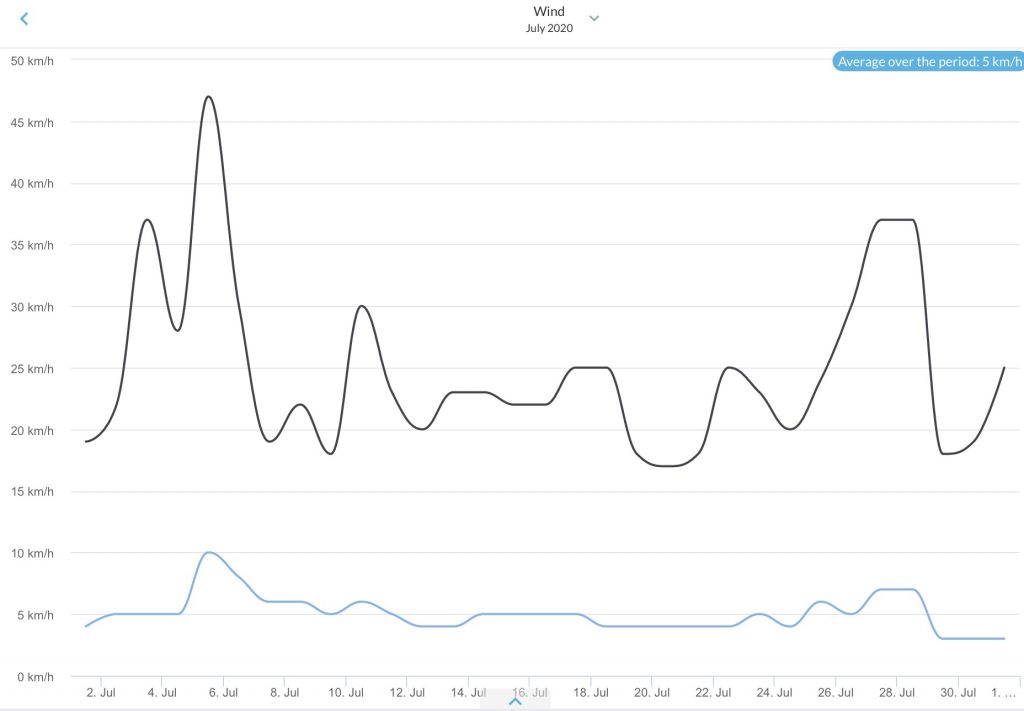
The average humidity was 71%, which explains why there were so many muggy, clammy, draining days. There wasn’t much wind around either with an average wind speed over July of just 5km/h.
| Months | Normal | Warmest | Coldest | Normal |
|---|---|---|---|---|
| July | 16.0°C | 20.9°C | 11.0°C | 8 |
I appreciate there’s not much we can read into because our data collection is still in its early days, but we have to start somewhere, and the most interesting takeaway is that it was a dry July.
We will analyze the data in August and see if any trends start to emerge, and our meteorological journey will truly be on its way.
Pointers, comments, feedback and advice welcome. Leave a comment below.